You push the final commit before a cutover. Everything is done. One PR to merge. You watch the blue spinner move through the jobs and wait. Then keep waiting. Thirty minutes later, the pipeline is still running.
That’s not a hypothetical. That’s what was happening on a React frontend NX monorepo with Babel, Webpack, running multiple parallel jobs on GitHub Actions. NX’s monorepo structure means each job that touches build or test needs the full dependency graph available, which made the repeated install cost hit every job independently. Nothing was broken. It was just slow in the way slow things usually get: one job added here, a step duplicated there, until the total billed compute time per PR run crept past 60 minutes.
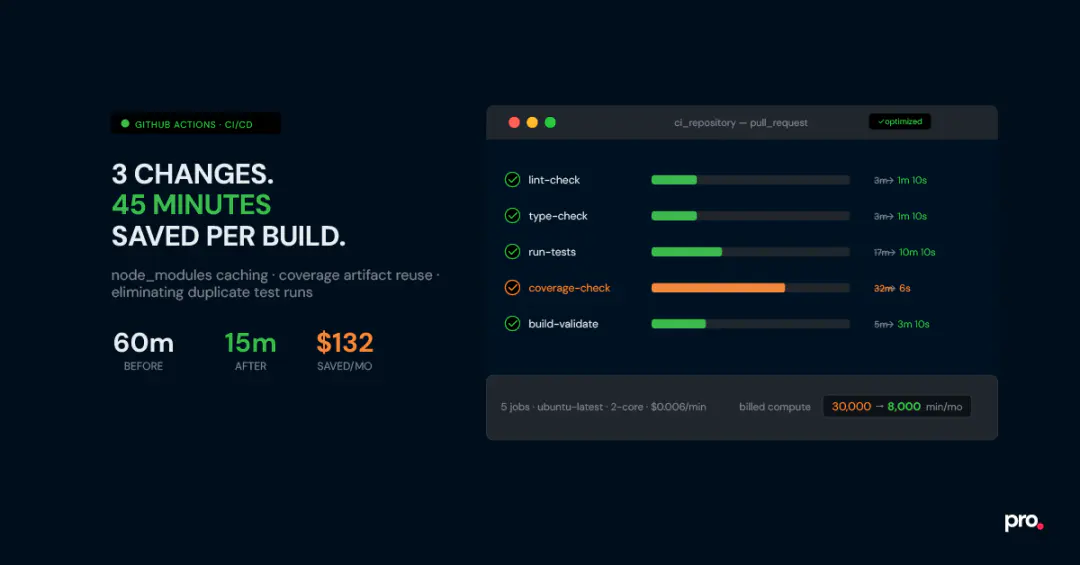
We brought it down to about 15 minutes of total run time, or 10 minutes, if you consider the parallel jobs, with three changes. No new tooling, no upgraded runners, no switching CI providers. The cost saving matters, but the bigger win was the feedback loop: 10 minutes is fast enough to stay focused on the task at hand. 60 minutes is long enough to context-switch somewhere else and lose the thread entirely. This post is a full walkthrough, including two patterns that aren’t widely documented and the mistakes that cost us time before we found the right solutions.
A Typical Frontend CI Pipeline on GitHub Actions (Before Optimization)
Five jobs, each running in parallel, each starting by installing its own copy of node_modules from scratch:
| Job | Steps | Time |
|---|---|---|
| Lint check | Install deps (2 min) + run lint (1 min) | \sim 3 \mathrm{~min} |
| Type check | Install deps (2 min) + run typecheck (1 min) | \sim 3 \mathrm{~min} |
| Tests | Install deps (2 min) + run tests (15 min) | \sim 17 \mathrm{~min} |
| Coverage check | Install deps (2 min) + PR tests with coverage (15 min) + main tests with coverage ( 15 min ) | \sim 32 \mathrm{~min} |
| Build validation | Install deps (2 min) + NX build (3 min) | \sim 5 \mathrm{~min} |
Because the jobs run in parallel, wall-clock time is determined by the slowest job, which was the coverage check at 32 minutes. But GitHub bills by compute minute, not wall-clock time. Running 5 parallel jobs means 5 separate billing meters. Even with parallel execution, the total billed compute time was over 60 minutes per PR run.
How GitHub Actions billing actually works
GitHub charges per compute minute on each runner, independently. So if you run 5 parallel jobs, each taking 10 minutes, that’s 50 billed minutes, not 10. Standard Linux runners (ubuntu-latest, 2-core) are currently $0.005 per minute for private repositories. Minutes are rounded up to the nearest whole minute per job.
Why Your GitHub Actions Workflow Is Slow: Three Root Causes
Most CI optimization guides give you a checklist of 15 things to try. That’s fine as a reference. But looking at this pipeline carefully, three structural problems stood out as the clear bottlenecks:
- node_modules was being installed five separate times. Every job started from zero, even though the dependency set was identical across all of them, most of the time.
- Main branch tests ran on every single PR. The coverage job needed a coverage baseline from main, and the way it was set up, it re-ran all tests on main from scratch every time a PR was opened.
- PR tests ran twice. Once in the test job, once again in the coverage job. Same code, same run, two separate compute charges.
Fix those three things, and you’re done. Here’s how each fix works.
How to Cache node_modules in GitHub Actions and Share It Across Jobs
The biggest waste in this pipeline was five separate npm install calls, one per job, every run. The fix is a dedicated setup_dependencies reusable workflow that runs install once, generates a cache key from the SHA hash of package-lock.json, and stores the result using actions/cache@v4. Every downstream job restores from that cache instead of reinstalling from scratch.
The reasoning behind using package-lock.json’s SHA key is to fetch the cache easily. If there are dependency updates in the repo, a new package-lock.json is created, which triggers a new cache because the SHA changes.Time saved: ~10 minutes per run. The per-job install time dropped from 2 minutes to about 10 seconds on cache hits.
.github/workflows/setup_dependencies.yml
name: Setup Dependencies
on:
    workflow_call:
        outputs:
            cache-key:
                description: 'Cache key for node_modules'
                value: ${{ jobs.setup.outputs.cache-key }}
jobs:
    setup:
        runs-on: ubuntu-latest
        outputs:
            cache-key: ${{ steps.set-cache-key.outputs.key }}
        steps:
            - uses: actions/checkout@v6
            - name: Generate cache key
                id: set-cache-key
                run: |
                        echo "key=${{ runner.os }}-node-cache-${{
hashFiles('**/package-lock.json') }}" >> $GITHUB_OUTPUT
            - uses: actions/setup-node@v6
                with:
                    node-version-file: '.nvmrc'
            - name: Cache node_modules
uses: actions/cache@v4
id: cache-npm
with:
path: node_modules
key: ${{ steps.set-cache-key.outputs.key }}
restore-keys: |
${{ runner.os }}-node-cache-
- name: Install dependencies
if: steps.cache-npm.outputs.cache-hit != 'true'
run: npm install.github/workflows/ci.yml
name: ci_repository
on:
push:
branches: [main]
pull_request:
jobs:
setup:
uses: ./.github/workflows/setup_dependencies.yml
test:
needs: setup
uses: './.github/workflows/test.yml'
with:
cache-key: ${{ needs.setup.outputs.cache-key }}The setup-node caching trap
The obvious first move is to pass cache: ‘npm’ inside actions/setup-node@v6. GitHub even documents this as the caching approach. The problem: with npm, this only caches at the tarball level, not the extracted node_modules directory. So npm install still runs on every job; it just downloads slightly faster. The time savings are negligible (maybe 20-30 seconds on a typical project).
This approach works well with pnpm, which has a global content-addressable store that can be shared. For npm, the right method is to explicitly cache the node_modules directory itself, keyed by the hash of package-lock.json. If the lockfile hasn’t changed, the full node_modules is restored and the install is skipped entirely.
How to Reuse GitHub Actions Artifacts to Skip Redundant Test Runs
The coverage job needed two inputs: a report from the current PR branch and a baseline from main. The way it was set up, every PR re-ran the full main test suite from scratch to generate that baseline. That’s 15 minutes of compute, repeated on every single PR. The fix is to decouple the two runs.
Tests are also run on the main branch. When a PR merges, the resulting coverage JSON is uploaded as a GitHub Actions artifact. Each subsequent PR’s coverage job then downloads the stored artifact instead of rerunning main’s tests from scratch.
Time saved: ~15 minutes per PR run.
.github/workflows/coverage_check.yml: artifact lookup section
- name: Find most recent successful main run
    id: find-main-run
    continue-on-error: true
    uses: actions/github-script@v7
    with:
        github-token: ${{ secrets.GITHUB_TOKEN }}
        script: |
            const runs = await github.request(
                'GET /repos/{owner}/{repo}/actions/workflows/{workflow_id}/runs',
                { owner: context.repo.owner, repo: context.repo.repo,
                    workflow_id: 'ci.yml', branch: 'main',
                    status: 'success', event: 'push', per_page: 1 }
            )
            if (runs.data.workflow_runs.length === 0) {
                core.setOutput('found', 'false'); return;
            }
            core.setOutput('run_id', runs.data.workflow_runs[0].id);
            core.setOutput('found', 'true');
- name: Download main coverage artifact
    if: steps.find-main-run.outputs.found == 'true'
    continue-on-error: true
    id: download-main-coverage
    uses: actions/download-artifact@v4
    with:
        name: main-coverage
        run-id: ${{ steps.find-main-run.outputs.run_id }}
        path: / tmp/main-coverage
        github-token: ${{ secrets.GITHUB_TOKEN }}
# Fallback: if no artifact found, run main tests from scratch
- name: Checkout main branch
    if: steps.download-main-coverage.outcome != 'success'
    uses: actions/checkout@v6
    with:
        ref: main
The cold start problem, and why the fallback matters
This pattern depends on a main branch coverage artifact already existing. That artifact is only generated after a successful push to main - so on a fresh repo, or on any PR opened before the first main merge, the baseline hasn’t been uploaded yet. If your download step has no fallback, the job errors out or, worse, silently skips enforcement and passes anyway.
The fix: add continue-on-error: true to the download step, then add conditional steps afterwards that run the main-branch tests from scratch only if the download fails. It adds a few lines to the
YAML but makes coverage enforcement reliable from day one, with no manual bootstrapping required.
How to Eliminate Duplicate Test Runs in a GitHub Actions PR Workflow
Every PR was triggering both the test job and the coverage-check job. Both ran the full test suite. The coverage job needed the test output, not a second execution. The fix: have the test job run with coverage enabled, upload a coverage artifact, and have the coverage-check job download it instead of rerunning tests.
Time saved: ~15 minutes per PR run from eliminating the duplicate test run. There’s a bonus here. On GitHub Actions’ standard 2-core Ubuntu runners, Jest defaults to using only one worker. This is a known behaviour: Jest doesn’t reliably detect the available CPU count in CI environments, so it falls back to a single worker instead of the two it could use. Explicitly setting –maxWorkers=2 on a 2-core runner significantly reduces test time. On this project, it saved about 5 additional minutes.
.github/workflows/test.yml
- name: Restore cached node_modules
    id: npm-cache
    uses: actions/cache/restore@v4
    with:
        path: node_modules
        key: ${{ inputs.cache-key }}
        restore-keys: |
            ${{ runner.os }}-node-cache-
- name: Install dependencies if cache miss
    if: steps.npm-cache.outputs.cache-hit != 'true'
    run: npm install
# Set --maxWorkers=2 explicitly (Jest defaults to 1 worker in CI
environments)
# and won't auto-detect both cores on a standard GitHub Actions runner
- name: Run tests with coverage
            run: npm test -- --coverage --coverageReporters=json-summary
--maxWorkers=2
- name: Upload main coverage artifact
    if: ${{ github.ref_name == 'main' }}
    uses: actions/upload-artifact@v4
    with:
        name: main-coverage
        path: coverage/coverage-summary.json
- name: Upload PR coverage artifact
    if: ${{ github.ref_name != 'main' }}
    uses: actions/upload-artifact@v4
with:
name: pr-coverage
path: coverage/coverage-summary.jsonOn maxWorkers and CI environments
Jest’s documentation says it defaults to the number of available cores in CI. In practice, on GitHub Actions standard runners (ubuntu-latest, 2 vCPU), it often detects only 1 and runs tests sequentially. Multiple teams have independently reported this. Setting –maxWorkers =2 explicitly unlocks the second core.
If you later move to a 4-core runner, update to –maxWorkers=4. Alternatively, use –maxWorkers=$(nproc) in a shell step to make it runner-agnostic.
Results: Time Saved, Cost Reduced, and the Math Behind It
After these three GitHub Actions optimization changes, the per-job times look like this:
| Job | Time after |
|---|---|
| Lint check | \sim 1 \mathrm{~min} 10 \mathrm{sec} |
| Type check | \sim 1 \mathrm{~min} 10 \mathrm{sec} |
| Tests | \sim 10 \mathrm{~min} 10 \mathrm{sec} |
| Coverage check | \sim 6 \mathrm{sec} |
| Build validation | \sim 3 \mathrm{~min} 10 \mathrm{sec} |
The coverage check went from the slowest job at 32 minutes to being effectively free. It now just downloads two JSON files and runs a comparison script.
Final wall-clock time dropped from 30 minutes to effectively 10 minutes.
Total savings per run: approximately 45 minutes of billed compute time.
The cost math, step by step Assumptions: 5 developers, each PR averaging 5 commits (each commit triggers a CI run), running 5 days a week.
5 developers x 5 commits/day x 20 working days =500 CI runs/month
Before optimization:
5 jobs x avg 12 min per job x 500 runs =30,000 billed minutes / month 30,000 times x $ 0.006= $ 180/month
After optimization:
Total compute per run: ~16 min across all jobs (lint 1m10s + type 1m10s + tests 10m10s + coverage 6s + build 3m10s) 16 min x 500 runs = 8,000 billed minutes/month 8,000 x $0.006 = $48/month
Net saving: ~$132/month.
Note on pricing: The standard Linux GitHub-hosted runner rate dropped from $0.008/min to \$ 0.006 / \mathrm{min} on January 1, 2026. The self-hosted runner platform charge that was also announced for 2026 was rolled back after community pushback; that change is unrelated to hosted runner pricing and does not affect this calculation. The exact dollar amount depends on your run volume and GitHub plan.
3 GitHub Actions Optimization Mistakes Worth Knowing About
Each of these looked like the correct approach at first glance. They weren’t.
Mistake 1: Trusting setup-node’s Built-in npm Caching
GitHub Actions npm caching guides almost always point to cache: ‘npm’ in actions/setup-node as the first option. The problem with npm specifically: it only caches the tarball download directory, not node_modules. That means npm install still runs in full on every job, re-extracting every package from those tarballs. You save at most 20-30 seconds. The fix, shown in Change 1 above, is to cache node_modules directly using actions/cache@v4, keyed on the hash of package-lock.json. On a cache hit, the install is skipped entirely.
Mistake 2: No Fallback for the Coverage Artifact Cold Start
The artifact reuse pattern depends on a main-branch coverage baseline existing before any PR attempts to download it. That baseline is generated on the first successful push to main, so any PR opened before that first merge will find nothing there. Without a fallback, the coverage job errors out or, worse, silently skips enforcement and reports success. The continue-on-error: true flag on the download step, combined with the conditional fallback block (shown in Change 2 above) handles this automatically.
Mistake 3: Trying to Optimize a Tangled Workflow Without Isolating It First
The original workflow file had grown into a mesh in which jobs passed outputs through a shared setup-ci job, making it hard to trace. Trying to isolate which step was the actual bottleneck required following a chain of dependencies across the file.
Think of it like untangling a set of interlocked tree branches: you pick up one branch, trace it to its root, detach it carefully, and replant it as its own small tree. Pull one job out into its own reusable workflow file, test it in isolation, and wire it back in. Repeat job by job. It’s the same instinct as breaking a monolith into services. Once each workflow file has a single responsibility, the dependency graph becomes visible, and bottlenecks are easy to spot.
Is Optimizing Your GitHub Actions Pipeline Worth the Effort?
GitHub Actions pipeline optimization is worth the time when the numbers justify it. If you have a two-person team and a pipeline under 8 minutes, there’s no urgency here. The coverage artifact workflow, in particular, takes a few hours to set up and debug correctly, especially the cold-start fallback.
The numbers start to justify the effort when you have five or more developers, a pipeline longer than 15 minutes, and a decent PR volume. At 500 runs/month on a 60-minute pipeline, you’re billing 30,000 compute minutes. Cutting that to 8,000 saves over $100/month at current rates.
That’s real money, but it’s also the smaller gain. The larger one is harder to put in a spreadsheet: when CI finishes in 15 minutes, developers stay on the problem. They see the result, adjust, push again. When it takes 60 minutes, they’ve mentally closed the tab. Restoring that feedback loop is worth more than the monthly bill.
If you found this post valuable, l’d love to hear your thoughts. Let’s connect and continue the conversation on LinkedIn.
Working With Slow or Messy Pipelines?
Procedure works with engineering teams on Node.js, React, and full-stack CI/CD. If your pipeline has grown into something nobody fully understands anymore, we’re happy to take a look.

Samarth Goyal
SDE2
Samarth Goyal is a SDE2 at Procedure. He is a tech tinkerer who enjoys turning ideas into clean, usable products. Curious by nature and driven by learning, he loves exploring new tools, systems, and architectures. With a strong foundation in full-stack development, AI workflows, and scalable SaaS systems, he blends engineering with design thinking. From building data pipelines to experimenting with LLMs, he's always optimizing, iterating, and pushing projects forward, one thoughtful line of code at a time.