The kube-prometheus-stack Helm chart gets Prometheus, Grafana, Alertmanager, node-exporter, kube-state-metrics, and the Prometheus Operator running in a Kubernetes cluster in minutes. That is the easy part.
The harder part starts after the dashboard loads.
A real Prometheus Kubernetes monitoring setup has to answer operational questions without overwhelming the team. How long should metrics be retained? Which alerts should page someone? Should every target be scraped every 15 seconds? What happens when one bad label creates thousands of time series? How do you make Grafana dashboards useful during incidents instead of decorative?
Most tutorials stop at installation. This guide focuses on the decisions that come after.
Setting up Prometheus on Kubernetes in production requires more than running helm install. A complete stack includes Prometheus, Grafana, Alertmanager, the Prometheus Operator, kube-state-metrics, and node-exporter. The critical decisions are storage configuration, retention policy, scrape interval tuning, ServiceMonitor conventions, and alert routing. This guide covers each one.
What the Prometheus Grafana Kubernetes Stack Actually Includes
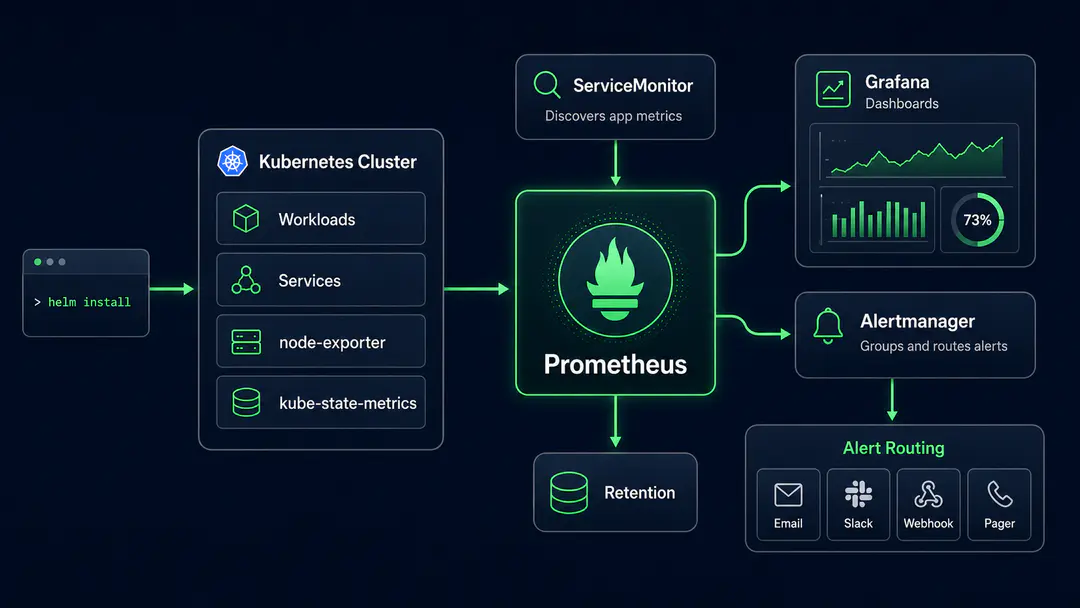
A complete Prometheus Grafana Kubernetes setup runs as several components working together, each owning a distinct part of the job.
Prometheus collects, stores, and queries time-series metrics. In Kubernetes, it scrapes metrics from workloads, nodes, services, exporters, and cluster components.
Grafana turns those metrics into dashboards. It is where teams inspect cluster health, workload behavior, node pressure, pod restarts, latency, error rates, and capacity trends.
Alertmanager handles routing, grouping, silencing, deduplication, and escalation. Prometheus evaluates alert rules, but Alertmanager decides where alerts go and how they are grouped. Most teams treat Alertmanager as a relay; it is actually the only component in the stack that controls whether an alert reaches anyone.
kube-state-metrics and node-exporter are passive exporters. kube-state-metrics surfaces Kubernetes object state: deployments, pods, nodes, jobs, daemonsets, resource requests and limits. node-exporter surfaces node-level CPU, memory, filesystem, network, and disk metrics. Both are required for a complete cluster view.
The Prometheus Operator makes this Kubernetes-native. Instead of editing prometheus.yml directly, teams define custom resources: ServiceMonitor, PodMonitor, PrometheusRule, and AlertmanagerConfig. The operator watches those resources and generates Prometheus configuration automatically.
That is why the kube-prometheus-stack Helm chart for Kubernetes is the default starting point. It bundles all of the above: default rules, dashboards, and the operator, into one maintained chart.
Teams like Spotify, Shopify, and GitLab run Prometheus as their core metrics layer on Kubernetes. It is the de facto standard for Kubernetes monitoring: the CNCF 2024 survey found Prometheus in use at 77% of organizations surveyed.
Kubernetes Monitoring Setup Prerequisites Before Installing Prometheus
Before installing Prometheus on Kubernetes, make sure the cluster can support the monitoring workload.
For a modern managed Kubernetes environment, version 1.25+ is a practical baseline. EKS, GKE, AKS, and other managed platforms work well as long as storage, ingress, networking, and RBAC are configured properly.
The most important requirement is persistent storage. Prometheus stores time-series data locally. If the pod uses ephemeral storage and gets rescheduled, metrics history disappears. That is acceptable in a test cluster. It is not acceptable for production debugging.
At minimum, prepare: a default or explicitly named storage class, persistent volumes for Prometheus, persistent storage for Grafana unless dashboards are provisioned as code, enough node capacity for monitoring workloads, a dedicated monitoring namespace, a controlled access path for Grafana, and a clear policy on who can change alert rules and dashboards.
Resource planning depends on cluster size, scrape interval, number of targets, number of time series, and retention period. A rough baseline:
| Cluster Size | Prometheus Request | Storage Baseline | Grafana | Alertmanager |
|---|---|---|---|---|
| Up to 20 nodes | 1 CPU / 4 GB RAM | 50–100 GB | 250m CPU / 512 MB | 100m CPU / 256 MB |
| 20–100 nodes | 2–4 CPU / 8–16 GB RAM | 200–500 GB | 500m CPU / 1 GB | 250m CPU / 512 MB |
| 100+ nodes | 4–8+ CPU / 16–32+ GB RAM | 500 GB–2 TB+ | 1 CPU / 2 GB | 500m CPU / 1 GB |
These are not universal numbers. A small cluster with undisciplined instrumentation can consume more Prometheus memory than a larger cluster with controlled cardinality. The real capacity drivers are: targets, series per target, scrape frequency, and retention period.
Frequently Asked Questions
What is kube-prometheus-stack and what does it include?
kube-prometheus-stack is a Helm chart that bundles Prometheus, Grafana, Alertmanager, the Prometheus Operator, kube-state-metrics, and node-exporter into a single installable package. It includes default alert rules, Grafana dashboards, and custom resource definitions for ServiceMonitor, PodMonitor, and PrometheusRule. It is the standard starting point for Prometheus Kubernetes monitoring.
Why is my ServiceMonitor not showing up in Prometheus targets?
The most common cause is label mismatch. The ServiceMonitor's selector must match the labels on the Kubernetes Service exactly. The second cause is that Prometheus is not selecting the ServiceMonitor itself. Check that your ServiceMonitor has the label Prometheus is watching for (often release: monitoring). Both selectors must match for scraping to begin.
How do I control high cardinality in Prometheus on Kubernetes?
Use metric_relabel_configs in your scrape configuration to drop high-cardinality labels before they reach TSDB. Avoid using user IDs, request IDs, pod names, or raw URL paths as label values. Monitor prometheus_tsdb_head_series and set an alert at roughly 70% of your tested instance ceiling. Run topk(20, count by (__name__)({__name__=~".+"})) to identify the most expensive metrics.
What scrape interval should I use for Kubernetes monitoring?
Use 15–30 seconds for critical service SLO metrics, 30 seconds for general application metrics, 30–60 seconds for Kubernetes object state via kube-state-metrics, and 60 seconds or more for low-priority exporters. A 30-second default scrape interval is the right choice for most Kubernetes clusters.
When should I add Thanos or Mimir to a Prometheus Kubernetes setup?
Add Thanos or Mimir when you need retention beyond 15–30 days, multi-cluster querying, downsampling for long-term dashboards, or durable storage that survives Prometheus pod restarts. Do not add them just to follow a tutorial. For a single cluster with operational monitoring needs, local Prometheus storage with a 15-day retention window is often sufficient.
What is the Prometheus Operator and why does it matter?
The Prometheus Operator is a Kubernetes controller that manages Prometheus instances and related components using custom resources. Instead of editing prometheus.yml directly, teams create ServiceMonitor and PrometheusRule objects that the operator translates into configuration. This makes monitoring Kubernetes-native: teams declare what they want scraped and alerted on the same way they declare deployments.
kube-prometheus-stack: Production Kubernetes Monitoring

Procedure Team
Engineering Team
Expert engineers building production AI systems.