Prometheus is the default metrics system for anything running on Kubernetes - the CNCF survey puts adoption north of 80% among container-using organisations. But most teams hit a wall between 2 and 5 million active time series. Queries slow down. Memory gets unpredictable. A cardinality spike from a single deployment takes the whole monitoring stack offline right when you need it most.
This guide covers what works beyond that threshold: vertical tuning, sharding strategies, federation, remote write-backends, and cardinality controls that prevent scaling issues from recurring.
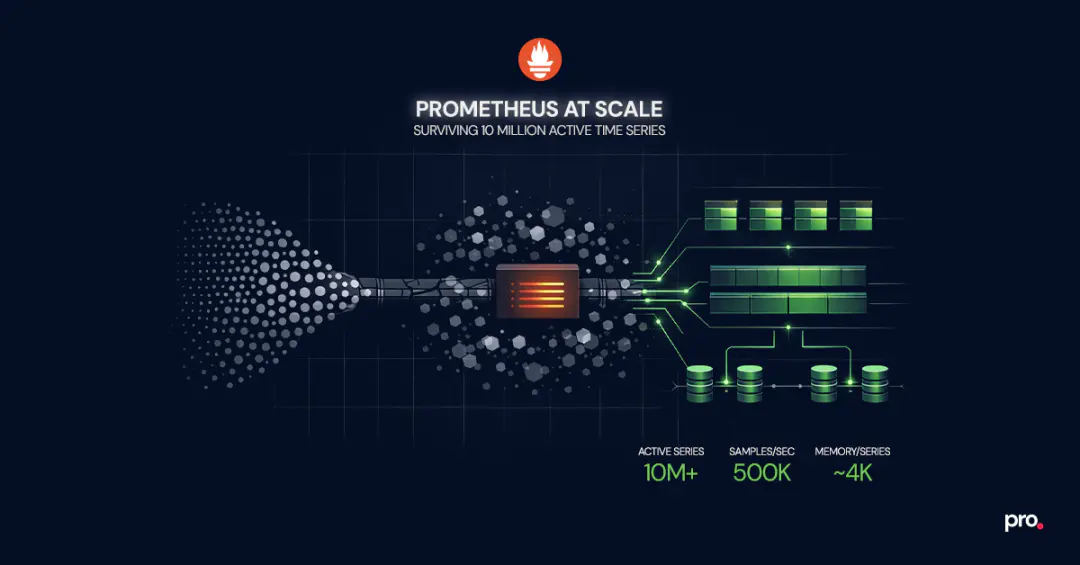
How to Scale Prometheus Past 5 Million Active Time Series
Scaling Prometheus past 5 million active time series requires a combination of vertical tuning, functional sharding, and offloading long-term storage to a dedicated backend. A single instance can push past the default comfort zone of 1 to 2 million series, reaching 10 million+ on hardware with 64GB+ RAM and fast SSDs, but only with careful cardinality management and query discipline. For most production environments, the reliable path is splitting scrape targets across multiple Prometheus instances by service domain, using federation or remote write for global visibility, and routing long-term queries to a backend like Thanos or Grafana Mimir.
Why Prometheus Hits a Wall: The TSDB Memory Model
Every active time series in Prometheus lives in memory. That is the design tradeoff that makes it fast for recent queries and fragile at high scale.
When Prometheus scrapes a target, it creates an in-memory structure called a memSeries for each unique combination of metric name and labels. Each memSeries holds a head chunk containing approximately two hours of samples. The TSDB compresses these chunks and eventually flushes them to disk, but the head block, the most recent two-hour window, always stays in memory.
The practical math: each active time series consumes roughly 4KB of memory for the Go runtime allocation. Double that to account for garbage collection overhead. A Prometheus instance with 5 million active time series needs approximately 40GB of Go heap, which means you need a machine with at least 64GB of physical RAM to leave headroom for queries, WAL operations, and compaction.
This is an intentional design choice that prioritises query speed for recent data. It means that scaling Prometheus is fundamentally a memory management problem, and every strategy in this guide traces back to that constraint.
Prometheus Cardinality: The Problem That Kills Before Hardware Does
Before you reach for more hardware or split into multiple instances, address cardinality. It is the single most common reason Prometheus deployments fail at scale, and no amount of infrastructure compensates for unbounded label values.
Cardinality is the total number of unique time series, determined by every distinct combination of metric name and label key-value pairs. A metric with three labels, each having 100 possible values, creates up to 1 million time series from a single metric definition. Add one more label with 10 values and that becomes 10 million.
The most dangerous sources in production:
- User IDs, request IDs, or session IDs as label values. Any label whose value comes from external input can grow unboundedly. A single service exposing a metric with
user_idas a label and 100K active users produces 100K time series from one metric alone. - Uncontrolled endpoint labels. HTTP path labels that include route parameters (
/api/users/12345) instead of route templates (/api/users/:id) create a new time series for every unique URL. - Pod name or container ID labels. In Kubernetes, pods churn constantly. If a pod name appears as a label value, every restart creates a new time series that persists in memory until the next head compaction. High-churn environments accumulate thousands of stale series per hour.
- Multi-dimensional cross products. Combining several labels that each have moderate cardinality (say, 50 values each) produces growth that is multiplicative, not additive. Five labels with 50 values each: 312 million potential time series.
Detecting and Controlling High Cardinality
Prometheus exposes internal metrics that help you catch cardinality problems before they become outages:
prometheus_tsdb_head_series: current count of active time series in the head blockprometheus_tsdb_head_chunks: number of chunks in memoryprometheus_target_scrape_samples_scraped: per-target scrape size, useful for identifying which targets contribute the most series
Set alerts on prometheus_tsdb_head_series to fire at roughly 70% of your tested instance ceiling. That gives enough lead time to investigate before memory pressure becomes critical.
For active reduction, use metric_relabel_configs in your scrape configuration to drop high-cardinality labels or entire metrics before they reach TSDB:
scrape_configs:
  - job_name: 'my-service'
    metric_relabel_configs:
      - source_labels: [__name__]
        regex: 'go_.*'
        action: drop
      - source_labels: [user_id]
        action: labeldrop
Reducing cardinality by 30% on a 5-million-series instance frees roughly 12GB of RAM. That is a hardware upgrade you get for free.
Vertical Scaling: Pushing a Single Prometheus Instance Further
Before splitting into multiple instances, push a single instance as far as it can go. The operational overhead of one well-tuned Prometheus server is dramatically lower than managing a fleet.
Operators have documented publicly that individual Prometheus instances can handle upwards of 10 million active time series with sufficient hardware. Cloudflare runs some instances at 30 million series each. In community benchmarks, a machine with 12 cores, 64GB RAM, and NVMe storage has been observed ingesting 500,000 samples per second across 11 million time series. That is more headroom than most teams realise, but it requires deliberate tuning, not just bigger hardware.
Practical tuning:
- Storage: Use NVMe SSDs. Prometheus TSDB is I/O-heavy during compaction and WAL replay. Spinning disks or network-attached storage (EBS gp3, for example) add latency that compounds under load.
- Go runtime tuning: Set
GOGCto a value lower than the default 100 (try 75 or 50) to trade CPU for tighter memory control. This reduces peak memory spikes from garbage collection pauses. - Scrape interval alignment: A 15-second scrape interval is standard, but if some targets are low-priority, increase their interval to 30 or 60 seconds. Fewer samples mean less memory pressure.
sample_limitper scrape: Set explicit limits on how many samples each scrape target can return. This is your circuit breaker against cardinality explosions from a single misbehaving service.- Query concurrency: Limit concurrent queries with
--query.max-concurrencyto prevent expensive PromQL queries from competing with ingestion for memory.
For most organisations with fewer than 50 Kubernetes nodes, a well-tuned single instance is sufficient. The instinct to shard too early adds operational cost without corresponding benefit.
Prometheus Sharding: Horizontal Scaling for High-Volume Environments
When a single instance genuinely cannot handle the scrape load, horizontal scaling is the next step. The goal is to distribute the workload so that each Prometheus instance operates within its comfortable capacity.
Functional Sharding by Service Domain
The simplest and most operationally manageable approach: assign different instances to different teams or service domains.
- infra-prometheus scrapes node exporters, kube-state-metrics, and cluster-level components
- app-prometheus scrapes application services and custom metrics
- network-prometheus scrapes network devices, DNS, and edge infrastructure
Each instance has its own scrape configuration, alert rules, and retention. Teams own their instance the same way they own their services. This maps cleanly to organisational boundaries and keeps blast radius contained.
The tradeoff: you lose a unified global view. A query that spans infrastructure and application metrics requires querying multiple instances. Federation or a remote storage backend addresses this.
Hashmod Target Sharding for Single-Domain Scale
When a single service domain produces more time series than one instance can handle, use hashmod-based target splitting. Each Prometheus instance scrapes a deterministic subset of targets based on a hash of the target address:
global:
  external_labels:
    shard: 1

scrape_configs:
  - job_name: 'large-service'
    relabel_configs:
      - source_labels: [__address__]
        modulus: 4
        target_label: __tmp_hash
        action: hashmod
      - source_labels: [__tmp_hash]
        regex: 1
        action: keep
This creates four shards (modulus 4), and this particular instance only keeps targets where the hash result is 1. Deploy four instances with shard values 0 through 3, and each scrapes exactly 25% of the targets.
Hashmod sharding is deterministic and requires no external coordination. Adding a new shard (changing modulus from 4 to 5) rebalances targets across all instances, causing a brief gap in metrics during the transition.
Prometheus Federation: Aggregated Visibility Across Instances
Once you are running multiple Prometheus instances, federation gives you aggregated visibility without centralising all raw metrics.
The pattern: a "global" Prometheus instance scrapes pre-aggregated recording rules from downstream instances. It does not scrape raw metrics. It pulls job: or shard: level aggregates that the downstream instances compute locally.
scrape_configs:
  - job_name: 'federate'
    honor_labels: true
    metrics_path: '/federate'
    params:
      match[]:
        - '{__name__=~"job:.*"}'
    static_configs:
      - targets:
        - 'shard-0:9090'
        - 'shard-1:9090'
        - 'shard-2:9090'
        - 'shard-3:9090'
This works well for leadership dashboards, cross-service SLO tracking, and alerting on aggregate health. It does not work well for ad-hoc debugging that needs raw per-pod or per-endpoint granularity. For that level of detail, query the shard directly or use a long-term storage backend.
The global federation instance must stay lightweight. Federating too many raw metrics recreates the original scaling problem at a higher layer. Only aggregate what genuinely needs a cross-instance view.
Long-Term Prometheus Storage with Remote Write
Prometheus was not designed for long-term storage. Its local TSDB works well for the most recent hours or days of data, but keeping months of metrics for capacity planning, compliance, or trend analysis requires an external backend.
The mechanism is remote write: Prometheus streams incoming samples to one or more endpoints in near real-time.
remote_write:
  - url: 'http://thanos-receive:19291/api/v1/receive'
    queue_config:
      max_samples_per_send: 10000
      capacity: 20000
Thanos adds a sidecar to each Prometheus instance that uploads TSDB blocks to object storage (S3, GCS, Azure Blob). A Thanos Querier provides a unified query interface across all instances and the object store. This is the pattern we see most often in Prometheus consulting engagements because it preserves the existing architecture and adds long-term retention without changing the ingestion path.
Grafana Mimir is a horizontally scalable TSDB that accepts remote writes directly. It handles deduplication, compaction, and multi-tenant isolation internally. Grafana Labs has tested it to 1 billion active series. If you are already in the Grafana ecosystem and need multi-tenant metrics, Mimir is the stronger fit.
VictoriaMetrics is a high-performance alternative that accepts Prometheus remote write and PromQL queries. It uses aggressive compression and typically requires 5 to 10x less storage than raw Prometheus TSDB for the same data. Good fit for teams that want long-term storage without the operational complexity of running Thanos or Mimir.
The decision usually comes down to existing infrastructure, multi-tenancy requirements (Mimir and VictoriaMetrics handle this natively, Thanos requires more configuration), and operational preference (Thanos stays closest to vanilla Prometheus, the other two are more opinionated).
Which Prometheus Architecture Fits Your Environment
| Environment | Active Time Series | Recommended Architecture |
|---|---|---|
| Single cluster, under 50 nodes | Under 2M | Single Prometheus instance, default settings |
| Single cluster, 50 to 200 nodes | 2M to 5M | Single instance with vertical tuning (NVMe, GOGC, sample limits) |
| Single cluster, 200+ nodes or high-cardinality workloads | 5M to 15M | Functional sharding (infra / app / network) + federation for global view |
| Multi-cluster or multi-region | 10M+ | Per-cluster Prometheus + Thanos or Mimir for unified querying and long-term storage |
| SaaS with multi-tenant metrics | 10M+ per tenant | Mimir or VictoriaMetrics with tenant isolation + Grafana |
Start with the simplest architecture that handles your current load plus a 2x growth buffer. Every additional instance is operational overhead: separate configs, separate alerting pipelines, separate on-call context. The goal is fewer instances, not more.
Operational Practices for Prometheus at Scale
Architecture gets you to 10 million time series. Operational discipline keeps you there.
Pre-compute expensive queries with recording rules. If a Grafana dashboard panel runs a PromQL query that touches 500K+ time series, convert it into a recording rule. Recording rules evaluate at a fixed interval and store the result as a new, inexpensive time series. Align retention to actual need. The default 15-day retention is often more than needed for operational monitoring. If long-term data lives in Thanos or Mimir, drop local retention to 6 to 12 hours. Less local data means faster WAL replay on restart and lower memory pressure.
Monitor Prometheus itself. Track prometheus_tsdb_compaction_duration_seconds, process_resident_memory_bytes, and scrape success rates. The monitoring system should never be the thing that silently breaks.
Enable WAL compression. Since Prometheus 2.11, --storage.tsdb.wal-compression reduces WAL size by 30 to 50% with minimal CPU overhead.
Plan for high availability. When Prometheus restarts, it replays the WAL to reconstruct in-memory state. With millions of time series, this takes 10 to 30 minutes. During that window, you have no monitoring. Run HA pairs (two instances scraping the same targets) so one is always available.
Five Mistakes That Break Prometheus in Production
These come up consistently across engagements:
1. Sharding before exhausting vertical options. A single instance with proper cardinality controls and NVMe storage handles more than most teams expect. Shard when you have evidence, not instinct.
2. Federating everything instead of aggregates. Federating {__name__=~".+"} to a global instance is not federation, it is replication. The global instance hits the same memory ceiling. Federate only pre-aggregated recording rules.
3. Running Prometheus on shared Kubernetes nodes without resource limits. A Prometheus pod without memory limits will get OOM-killed by the kernel when the node runs low. Set requests and limits explicitly, and give Prometheus its own dedicated node pool if it is critical infrastructure. Teams running production Kubernetes clusters at scale typically isolate observability workloads from application pods.
4. Using Prometheus as a data warehouse. Prometheus is an operational monitoring tool, not a business analytics backend. Queries that scan months of data across hundreds of thousands of series belong in a dedicated analytical store.
5. Ignoring stale series from pod churn. When targets disappear, their time series become stale but memory is not immediately freed. High-churn environments (CI/CD pipelines, autoscaling groups) accumulate stale data faster than compaction clears it.
When Prometheus Is Not the Right Tool
Not every monitoring problem should be solved with Prometheus.
If your primary need is distributed tracing, Jaeger or Tempo are better starting points. Prometheus tracks aggregate request rates and latency percentiles, but it does not capture individual request traces across services.
For log-centric monitoring, where the signal lives in structured events, audit trails, or compliance records, Grafana Loki or the ELK stack handle that pattern natively. Prometheus is not a log aggregation tool and should not be forced into that role.
And if you need per-request, high-cardinality analytics where you break down metrics by individual user, transaction, or session, Prometheus's label-based model will fight you at every step. ClickHouse and similar columnar stores are designed for exactly that kind of exploratory, high-dimensional query.
Where Prometheus has no equal is infrastructure and service-level metrics: CPU, memory, request rates, error rates, latency percentiles, queue depths. At that job, nothing else in the open-source ecosystem comes close.
Wrapping Up: What Matters Most When Scaling Prometheus
Scaling Prometheus is less about finding the right tool and more about making deliberate decisions early. Fix cardinality before you throw hardware at the problem. Push vertical tuning before you introduce sharding complexity. Pick a long-term storage backend before your retention window forces the choice.
The teams that run Prometheus well at 10 million series are not doing anything exotic. They are doing the basics with discipline and catching problems before they compound.
If you are building or scaling a Prometheus deployment and want a second opinion on architecture, cardinality strategy, or storage decisions, take a look at how we approach Prometheus consulting and commercial support.
Frequently Asked Questions
How many time series can a single Prometheus instance handle?
A well-tuned instance on hardware with 64GB RAM and NVMe SSDs can handle 10+ million active time series and ingest roughly 500,000 samples per second. Most production instances run comfortably between 2 and 5 million.
What causes Prometheus to run out of memory?
Every active time series lives in memory as part of the TSDB head block, at roughly 4KB per series before GC overhead. Cardinality explosions from unbounded label values (user IDs, request paths, unconstrained pod names) are the most common trigger.
Should I use Thanos or Mimir for long-term storage?
Thanos fits best when you want to keep your existing Prometheus setup and add retention via object storage. Mimir fits best when you need multi-tenant isolation or are already deep in the Grafana ecosystem.
What is a cardinality explosion?
It is when a metric generates an unexpectedly large number of time series due to a label with many distinct values. A single metric with one unbounded label can produce millions of series, exhausting memory and crashing Prometheus.
How do I set up Prometheus high availability?
Run two identical instances scraping the same targets. Both ingest independently. If one goes down for restart or WAL replay, the other keeps serving queries and alerts. Thanos or Mimir handle deduplication when both feed into the same backend.

Procedure Team
Engineering Team
Expert engineers building production AI systems.