Every React performance article opens the same way: a numbered list of optimisation techniques, starting with React.memo and ending with code splitting. You scan it, nod along, maybe refactor a component or two. Nothing measurably changes.
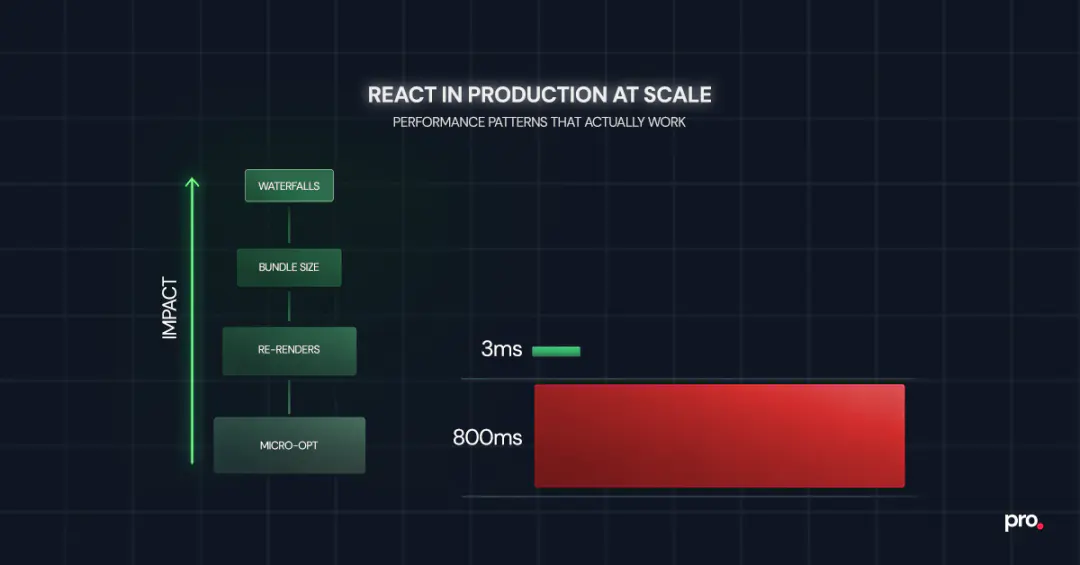
The problem is not the techniques. It is the order. Most teams spend hours eliminating re-renders in a component that contributes 3ms to total render time while a request waterfall on the same page adds 800ms of dead wait. The techniques are correct. The prioritisation is backwards.
What follows is a production performance playbook for teams running React at scale, structured around what to fix first, how to measure whether it worked, and when to stop.
How to Optimise React Performance in Production
React performance optimisation in production follows a clear hierarchy: fix async request waterfalls first, reduce JavaScript bundle size second, eliminate unnecessary re-renders third, and micro-optimise last. Most teams invert this order, starting with memoisation when the real bottleneck is network-level.
The highest-impact pattern is profiling before acting: use browser performance tools and the React DevTools Profiler to identify the actual bottleneck, then apply the fix that matches it.
Premature memoisation adds code complexity without measurable gains. Effective performance work is systematic, not reactive.
The Performance Hierarchy: What to Fix First
React performance optimisation has a natural priority order that most guides skip entirely. Fixing things at the top of this hierarchy has 10x to 100x more impact than fixing things at the bottom. Yet the bottom is where most teams start, because re-render fixes feel productive and are easy to reason about.
Here is the order that matters in production:
1. Async request waterfalls. When your page makes a fetch call, waits for the result, then makes another fetch call that depends on the first, users sit through cumulative latency. Vercel's react-best-practices framework identifies this as the single highest-impact performance problem across production codebases. A three-step waterfall where each call takes 200ms costs 600ms of dead wait. Running them in parallel brings that to 200ms. No amount of memoisation compensates for this.
2. JavaScript bundle size. Every kilobyte of JavaScript you ship must be downloaded, parsed, and executed before the user sees anything interactive. The HTTP Archive's annual web report shows that median JavaScript payload for single-page applications continues to grow year over year. If your React bundle is 400KB gzipped and your competitor's is 150KB, you are losing the performance race before a single component renders.
3. Unnecessary re-renders. This is where most optimisation guides begin, and that is exactly why they underdeliver. Re-render work matters, but only after the first two layers are handled. A component re-rendering 5 times when it should render once is worth fixing. But it is a 50ms problem, not an 800ms problem.
4. Micro-optimisations. Inlining constants, avoiding object spread in hot paths, replacing Array.map chains with single-pass loops. These are legitimate in extremely hot code paths. For 95% of React applications, they are noise.
The reason this hierarchy matters is compounding. Fix a waterfall and every user on every device benefits immediately. Fix a re-render and only the users who trigger that specific interaction on slower devices notice.
Profiling Before Optimising: The Workflow That Prevents Wasted Effort
The single most common performance mistake in React teams is optimising without measuring first. Someone notices a slow page, adds React.memo to a few components, ships it, and calls it done. The page is still slow because the bottleneck was a layout shift from a lazy-loaded image, not a render cycle.
A reliable workflow has four steps: measure, identify, fix, verify.
Measure. The React DevTools Profiler shows which components rendered, how long each render took, and what triggered the render. Sort by render duration and start at the top. If nothing in the profile exceeds 16ms (one frame at 60fps), re-renders are not your problem. Look elsewhere.
Identify. The Chrome DevTools Performance tab shows the full picture: JavaScript execution, layout, paint, compositing. Long tasks (anything blocking the main thread for more than 50ms) show up as red bars. If most of your long tasks are JavaScript evaluation on page load, the bottleneck is bundle size. If they are network-bound, you have a waterfall problem.
Fix. Apply the pattern that matches the bottleneck. If the problem is bundle size, the fix is code splitting and lazy loading, not memoisation. If the problem is a render cascade triggered by Context, the fix is state colocation or an external store, not wrapping everything in React.memo.
Verify. After the fix ships, run the same profiling workflow. If the metric you targeted (Largest Contentful Paint, Total Blocking Time, Interaction to Next Paint) did not improve, the fix missed. This step is where most teams cut corners, which is why performance regressions accumulate silently.
For teams thinking about long-term frontend health, getting the foundational architecture decisions right makes profiling and iterative performance work substantially easier down the line.
Reducing Bundle Size With Code Splitting and Tree Shaking
Bundle size is the most underrated React performance problem because it does not show up as a slow interaction. It shows up as a slow first load, which teams tend to attribute to the network rather than to what they are shipping over it.
Three patterns that reliably reduce what you ship to the browser:
Route-based code splitting with React.lazy and Suspense. The simplest and highest-impact approach. Instead of shipping your entire application in one bundle, split at route boundaries so each page loads only the JavaScript it needs. React's lazy loading API covers the mechanics. The real-world impact is significant: an e-commerce application with 40 routes can drop its initial bundle from 380KB to under 120KB by splitting at the route level.
import { lazy, Suspense } from 'react';

const Dashboard = lazy(() => import('./pages/Dashboard'));
const Settings = lazy(() => import('./pages/Settings'));

function App() {
  return (
    <Suspense fallback={<PageSkeleton />}>
      <Routes>
        <Route path="/dashboard" element={<Dashboard />} />
        <Route path="/settings" element={<Settings />} />
      </Routes>
    </Suspense>
  );
}
Dependency auditing. Run npx source-map-explorer build/static/js/*.js or use Bundlephobia to check what your dependencies actually cost. Common offenders: moment.js (300KB, replaceable with date-fns or dayjs at 7KB), lodash full import (70KB, replaceable with individual function imports at 2-4KB each), and icon libraries imported wholesale instead of per-icon.
Tree shaking validation. Modern bundlers (Vite, webpack 5+) support tree shaking, but it only works when libraries use ES modules and when your import patterns allow dead code elimination. Named imports (import { debounce } from 'lodash-es') tree-shake. Default imports from barrel files often do not. Verify with your bundle analyser, not with assumptions.
Bundle size is not a one-time fix. It drifts upward with every new dependency and feature. The teams that keep it under control are the ones that measure it in CI and block PRs that push it past a threshold.
How React Reconciliation Works and Why Re-Renders Are Usually Cheap

React reconciliation is the algorithm React uses to diff the virtual DOM against the previous render and determine which real DOM nodes need updating. Understanding it at a practical level is what separates effective performance work from guessing.
When state changes in a React application, the component that owns the state re-renders, and every child component in its subtree also re-renders by default. This is not a bug. It is how React's rendering model works. The reconciliation step then diffs the output and only commits actual DOM changes where the output differs.
The performance implication: re-rendering is usually cheap. The React team designed it that way. Committing DOM changes is expensive. If a component re-renders but produces the same output, React skips the DOM commit entirely. The component function still runs (costing CPU time), but the cost is negligible for simple components.
Where re-renders become a real problem:
Deep component trees with expensive render functions. If a component at the top of the tree re-renders and it has 200 descendants, all 200 will re-execute. When any of those descendants do expensive work during render (filtering a 10,000-item list, computing chart layouts, parsing dates), the cumulative cost adds up.
Frequent state updates in shared ancestors. A search input that updates state on every keystroke, where that state lives in a top-level provider, triggers a full subtree re-render. Move the state closer to where it is used, or debounce the updates.
Context consumers reacting to unrelated changes. If your context object bundles ten different values and a component only reads one, it still re-renders when any of the ten change. The fix is structural: split contexts by update frequency, or move to an external store with selector-based subscriptions.
When React.memo, useMemo, and useCallback Actually Help
The three memoisation tools in React are the most over-applied performance patterns in the ecosystem. They are powerful when used correctly and counterproductive when used indiscriminately.
React.memo wraps a component and skips re-renders when props have not changed (shallow comparison). It helps when: the component is expensive to render, it sits below a parent that re-renders frequently, and its props are stable (primitives, memoised objects, or refs). It does not help on components that receive new objects or arrays on every render, because the comparison fails every time and the wrapper adds overhead for no benefit.
useMemo caches the result of an expensive computation between renders. Useful for filtering or sorting large datasets, computing derived state from props, or creating stable references passed to memoised children. The React documentation is explicit that this is an optimisation hint, not a semantic guarantee. Do not use it for simple arithmetic or values that change on every render anyway.
useCallback caches a function reference between renders. Its primary use case is preventing re-renders of memoised children that receive the function as a prop. If the child is not wrapped in React.memo, useCallback does nothing useful.
The React Compiler (v1.0, stable since October 2025) automates these decisions at build time. It is compatible with React 17 and up. For teams with the compiler enabled, manual useMemo and useCallback calls are increasingly unnecessary. The compiler analyses component functions and inserts memoisation where the cost-benefit is positive. This does not eliminate the need to understand the concepts: architectural decisions about where state lives and how context is structured still determine whether the compiler can help.
| Situation | Recommended Action |
|---|---|
| Component renders in under 1ms, parent re-renders occasionally | Do nothing. The cost of the wrapper exceeds the savings. |
| Component renders in 5ms+, parent re-renders on every keystroke | Wrap with React.memo. Stabilise props with useMemo or useCallback. |
| List rendering 1,000+ items with complex row components | Virtualise the list first (react-window, tanstack-virtual). Memoise rows second. |
| Context provider causes cascading re-renders across unrelated consumers | Split the context by update frequency, or replace with Zustand or Jotai. |
| Using React 19+ with the React Compiler enabled | Remove manual memoisation. Let the compiler handle it. Profile to verify. |
How React Server Components Change the Performance Equation
React Server Components (RSC) represent the most significant architectural shift since hooks. They run on the server, send rendered HTML and a serialised component tree to the client, and never ship their JavaScript to the browser.
For teams using Next.js (the primary production framework supporting RSC today), the mental model shift is substantial: components are server components by default. You opt into client-side interactivity with 'use client' only where you need it.
The performance implications are concrete. A dashboard page that fetches data and renders charts can keep all data fetching and transformation logic on the server. Only the interactive chart component ships JavaScript to the browser. Server components also eliminate client-side waterfalls entirely: they query databases or internal services directly on the server, where latency between services is measured in microseconds rather than the hundreds of milliseconds a browser-to-API round trip costs. With React Suspense, RSC streams content progressively so users see the shell of a page immediately while data-dependent sections fill in as their server-side queries resolve.
When RSC is not the right fit: highly interactive applications where most components need client-side state (collaborative editors, real-time dashboards with user-driven filtering), applications not running on a Node.js server, or teams that cannot adopt a framework supporting RSC.
The decision is not all-or-nothing. A realistic production pattern: server components for data-heavy, read-oriented pages (product listings, documentation, settings), client components for interactive elements within those pages (search, filters, forms).
State Management Choices That Affect Performance at Scale
State management is where performance problems become architectural. The wrong choice does not just slow down one component. It creates a re-render pattern that affects the entire application.
React Context is the most common source of performance-related state management issues. Context was not designed for high-frequency updates. When rapidly changing values (input text, cursor position, animation state) live in Context, every consumer re-renders on every change, regardless of whether they use the changed value.
Colocate state where it is consumed. Before reaching for any state management library, ask whether the state needs to be shared at all. A form's input values usually belong in the form component, not in a global store. Moving state closer to its consumer eliminates entire categories of unnecessary re-renders.
Separate contexts by how often they change. If you must use Context, keep values that change frequently (user input, real-time data) in a different provider from values that change rarely (user preferences, theme, feature flags). Two small contexts are cheaper than one large one that triggers re-renders everywhere.
Use external stores for complex shared state. Libraries like Zustand, Jotai, and Redux Toolkit use subscription models that let components re-render only when their specific slice of state changes. For applications with 50+ components reading from shared state, this architecture change often has more impact than any amount of memoisation.
Treat server data as a cache, not as app state. Data fetched from APIs is not application state. It is a cache of server state. Dedicated data-fetching libraries like TanStack Query or SWR handle loading states, caching, and background refetching without triggering unnecessary re-renders across your component tree.
The practical test: if you open the React DevTools Profiler and see components re-rendering that should not be, the first question is not "should I add memo?" It is "why does this component subscribe to state it does not use?"
Monitoring Performance in Production: A Three-Layer Setup
Performance work without production monitoring is guesswork. You optimise locally, ship the change, and assume it helped. Meanwhile, the next sprint adds a new dependency that pushes the bundle past your threshold, and nobody notices until a customer complains.
Layer 1: Lighthouse CI in the deployment pipeline. Run Lighthouse on every pull request. Set budgets for performance score, Total Blocking Time, and Largest Contentful Paint. If a PR pushes any metric past the budget, the build fails before the code reaches production. This catches regressions at the earliest possible point.
Layer 2: Real User Monitoring (RUM) in production. Synthetic tests run on controlled hardware. Your users do not. Core Web Vitals collected from real sessions via the web-vitals library or a service like Sentry Performance show what the experience actually looks like on a mid-range Android phone on a 4G connection. The gap between your Lighthouse score and real-user metrics is where the most impactful performance work often lives.
Layer 3: React-specific error and performance tracking. Sentry's React integration captures component render times, transaction traces, and error boundaries. LogRocket records session replays that let you see exactly what a user experienced when a page was slow. These tools answer the question "what happened?" when a metric degrades.
The minimum viable setup: Lighthouse CI in your CI/CD pipeline (free, open-source) and the web-vitals library reporting to whatever analytics platform you already use (also free). Everything else is useful but optional for teams just starting with performance monitoring.
When Not to Optimise: The Hidden Cost of Premature Performance Work
Here is the sharp truth that performance guides rarely state: most React applications do not have a performance problem. They have a perceived performance problem driven by developer anxiety, not by user metrics.
If your Largest Contentful Paint is under 2.5 seconds, your Interaction to Next Paint is under 200ms, and your Cumulative Layout Shift is under 0.1, you are in the "good" range for Core Web Vitals. Adding React.memo to 40 components will not move those numbers. It will add 40 components' worth of complexity to your codebase that every future developer needs to understand and maintain.
Cognitive load. Every useMemo, useCallback, and dependency array is a contract. Get the dependency array wrong and you introduce a stale data bug that is harder to debug than the performance issue it was supposed to prevent.
Code review friction. "Should this be memoised?" becomes a recurring debate in pull requests. Without profiling data, neither side can prove their case. The debate consumes engineering time and rarely produces a measurable outcome.
False confidence. A team that wraps everything in React.memo believes they have handled performance. They have not. They have handled re-renders, which is only the third priority in the hierarchy. The waterfall and bundle problems are still there.
The rule of thumb: do not optimise what you have not measured. If a user or a metric is not telling you something is slow, it is not slow enough to justify the complexity of the fix.
Final Say
The patterns in this post are the ones that actually move production metrics: fix the waterfall, shrink the bundle, profile before memoising, monitor after shipping.
We have applied this exact playbook across React applications in fintech, payments, and media, building SPAs, dashboards, and component libraries where render performance directly affects revenue. If your team is dealing with slow loads, ballooning bundles, or re-render cascades you cannot pin down, take a look at how our frontend engineering team approaches these problems.
Frequently Asked Questions About React Performance
How do you optimise React performance in production?
Start by profiling with the React DevTools Profiler and the Chrome Performance tab to identify the actual bottleneck. Then follow the performance hierarchy: fix async request waterfalls first, reduce bundle size with code splitting and tree shaking second, and address unnecessary re-renders third. Most production performance issues live in the network and bundle layers, not in component rendering.
What causes unnecessary re-renders in React?
A component re-executes whenever its parent re-renders or its own state changes. Unnecessary re-renders happen when the output would be identical. Common causes: state stored too high in the component tree, Context providers that bundle unrelated values, and unstable object or function references passed as props to children.
When should you use useMemo vs useCallback?
useMemo caches the result of an expensive computation (filtering large lists, computing derived data). useCallback caches a function reference, primarily to prevent re-renders of children wrapped in React.memo. If the child is not memoised, useCallback does nothing useful. With the React Compiler (React 19+), both are increasingly handled automatically at build time.
How do you reduce React bundle size?
Route-based code splitting with React.lazy and Suspense is the highest-impact approach. Then audit dependencies: replace heavy libraries (moment.js, full lodash imports) with lighter alternatives. Validate tree shaking by checking your bundle with source-map-explorer or webpack-bundle-analyzer. Set bundle size budgets in CI to prevent drift.
How do React Server Components improve performance?
Server Components run entirely on the server and never ship JavaScript to the browser. This reduces the client-side bundle, eliminates client-side data fetching waterfalls since server components query databases directly, and enables streaming with Suspense so users see content progressively.
Is React slow for large applications?
React itself is not slow. Most performance issues in large React applications come from architectural decisions: where state lives, how data is fetched, how much JavaScript is shipped to the browser. A well-architected React application with proper code splitting, server components for static content, and state colocation performs comparably to any modern framework at scale.
What is the difference between React.memo and useMemo?
React.memo is a higher-order component that prevents a component from re-rendering when its props have not changed. useMemo is a hook that caches the result of a computation between renders. React.memo controls whether a component re-renders at all. useMemo controls whether an expensive calculation inside a component runs again.
How do you monitor React app performance in production?
Use a three-layer approach: Lighthouse CI in the deployment pipeline to catch regressions before production, Real User Monitoring via the web-vitals library to track actual user experience, and React-specific tracing (Sentry or LogRocket) for component-level diagnostics when metrics degrade.

Procedure Team
Engineering Team
Expert engineers building production AI systems.