
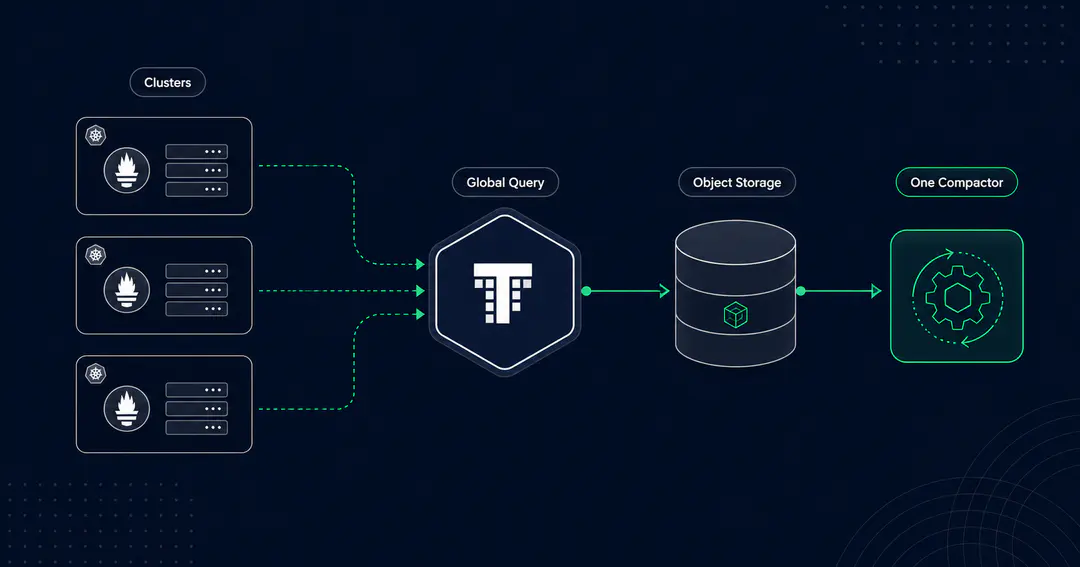
You have already decided Thanos is the right long-term storage layer for Prometheus. If you are still weighing that call against Mimir or VictoriaMetrics, the long-term storage decision guide is the better place to start. This piece assumes the choice is made and you are now running Thanos across more than one cluster, which is where the interesting failures live.
A single-cluster Thanos setup is forgiving. You add a Sidecar, point it at object storage, run a Store Gateway and a Querier, and it mostly behaves. Multi-cluster is a different animal. The moment you fan out queries across regions, replicate the same series into more than one place, and let a compactor loose on a shared bucket, a set of failure modes shows up that no quickstart prepares you for. Here are the three that cause the most production pain, and what actually fixes them.
Thanos Global Query Fan-Out: Your View Is Only as Fast as Your Slowest Store
The appeal of multi-cluster Thanos is the global view. One Querier, one PromQL endpoint, every cluster's metrics behind it. Grafana points at Thanos Query and stops caring which cluster a series came from.
The mechanism behind that convenience is fan-out. When a query lands, the Querier calls every store it knows about in parallel: each cluster's Sidecar or Receiver for recent data, and the Store Gateway for anything already in object storage. It waits for the responses, deduplicates overlapping series, and merges the result. That parallel call is also the weak point. A global query completes only when the slowest store responds, so one lagging Store Gateway or one cross-region hop with high latency drags the whole dashboard down. Teams often read this as "Thanos is slow" when the real story is a single slow participant in the fan-out.
Two settings decide how this feels day to day. Partial response controls whether a query returns what it has when one store times out, or fails the whole request. Returning partial data keeps dashboards alive during a regional blip, at the cost of silently incomplete graphs, so it is a deliberate tradeoff rather than a default to leave unexamined. The per-store timeout decides how long the Querier waits before giving up on a laggard. Set it too high and one bad region freezes every dashboard. Set it too low and legitimately slow historical queries start failing.
Debugging fan-out used to mean guesswork about which store was slow. Thanos 0.42.0, released in July 2026, now surfaces fan-out information directly in Query, so you can see how a request was distributed across stores instead of inferring it from traces. The same release fixed a subtle multi-tier bug: in topologies where one Querier sits in front of another (Query A calling Query B calling a Sidecar), external label matchers were being stripped and requests could route to the wrong stores. If you run tiered Queriers for scale, which many multi-region setups do, that fix alone is a reason to upgrade.
There is a network angle worth knowing when your clusters sit in different regions. Fan-out moves a lot of series over gRPC, and cross-region egress is not free. The 0.41.0 release added batching at the gRPC level and much better label compression, and in many cases Thanos now uses less than half the network throughput it did before. If you are on an older version and your inter-region bandwidth bill looks high, an upgrade is the cheapest optimisation available. For the broader question of keeping Prometheus itself healthy under this kind of load, the Prometheus at scale write-up covers the source side.
Thanos Sidecar vs Receiver at Multi-Cluster Scale
Most teams meet Thanos through the Sidecar. It rides alongside each Prometheus, uploads completed TSDB blocks to object storage, and exposes recent data over the Store API. It is the lowest-friction way in and it is genuinely fine for a handful of clusters.
At real multi-cluster scale the picture shifts. The Sidecar model means every cluster's Prometheus needs a path to object storage and every Sidecar is a store the global Querier must fan out to, which grows the fan-out surface linearly with cluster count. This is why the community has largely moved to the Receiver, or plain remote-write, once the cluster count climbs. With the Receiver, each Prometheus remote-writes into a central ingestion tier that handles object storage, and the query path stops depending on reaching every remote Sidecar. The tradeoff is that you now run and scale a stateful ingestion service, which is real operational weight rather than a free win.
One long-standing wrinkle is worth clearing up because outdated guides still repeat it. It used to be that running the Sidecar meant disabling local Prometheus compaction, an easy footgun if you missed it. That constraint is gone: the TSDB now delays its own compaction until the shipper has uploaded a block, so local compaction and Sidecar uploads coexist safely. If a runbook in your wiki still tells engineers to switch off Prometheus compaction for Thanos, it is out of date.
Thanos Downsampling and Retention: Which Resolution You Serve
Downsampling is the feature that makes multi-year retention affordable, and also the one teams configure once and never revisit. The Compactor produces three resolutions of every block: raw, five-minute, and one-hour. A year-long dashboard rendered from raw samples pulls an enormous number of data points and feels sluggish, while the same view from the one-hour resolution is fast and, for a year-scale trend, just as readable.
The part that trips people up is that downsampling does not save storage. It adds it. Each resolution is a separate copy in object storage, so enabling five-minute and one-hour downsampling increases your bucket size in exchange for query speed. That is usually the right trade, but it means retention has to be set per resolution rather than globally.
A common, sensible pattern is to keep raw data for a few weeks, five-minute data for a few months, and one-hour data for a year or more, matching resolution to how far back anyone actually queries at full detail. Get this wrong in the expensive direction and you are paying to store raw samples nobody queries. Get it wrong in the other direction and last quarter's incident has already been downsampled past the detail you needed.
Retention only takes effect if the Compactor is actually running and healthy, which turns out to be the real risk. For how downsampling fits into a full Kubernetes monitoring stack, the production Prometheus monitoring stack guide has the surrounding context.
The Thanos Compactor: The Single Point of Failure Nobody Budgets For

If one component ruins Thanos weekends, it is the Compactor. It compacts small blocks into larger ones, performs downsampling, and enforces retention. Everything above depends on it working. And it has a design constraint that surprises people: only one Compactor may run against a given bucket at a time. It is not a component you scale by adding replicas. Two Compactors on the same bucket will corrupt data. You get availability through sharding by external labels, not through replication, which is the opposite of the mental model most Kubernetes operators bring.
The classic outage is a halted Compactor. When two or more blocks share the same external labels and overlap in time, Thanos treats it as an unhealthy state and stops the Compactor rather than risk bad data. Once halted, nothing compacts, nothing downsamples, retention stops being enforced, and object storage quietly fills with small uncompacted blocks.
Query performance degrades in parallel, because the Store Gateway now has to read a swamp of tiny files. The failure is silent until someone notices the storage bill or the slow queries, which is why Compactor health deserves its own alert rather than living inside a general dashboard.
The usual root cause of overlapping blocks is external labels that are not unique and persistent per Prometheus. Each Prometheus instance feeding the bucket needs a distinct, stable set of external labels so the Compactor can group blocks correctly. If two clusters accidentally ship with the same replica label, or an instance's labels change on restart, you get overlap and a halt.
There is a legitimate case for overlapping data too: when you run Receivers with replication greater than one, the same samples land more than once by design. That is what vertical compaction and Thanos deduplication are for, and it is worth enabling deliberately rather than discovering it after the first halt.
One genuine footgun here was fixed recently. Before Thanos 0.42.0, replica labels marked for deduplication were still being included in the Compactor's hashmod calculation, which could inadvertently split or misgroup blocks. The July 2026 release removes those labels from that calculation. If you deduplicate across replicas and run an older version, this is another concrete reason to upgrade.
Thanos Version and Security Notes Before You Ship
First, versioning is a security concern, not just a feature one. Thanos 0.42.0 patched CVE-2026-33186, a high-severity authorization bypass through malformed request paths. If your Thanos components are exposed to any untrusted network path, pinning to 0.42.0 or later is the baseline, and worth flagging to whoever owns your upgrade cadence.
Second, keep an eye on where the project is heading without betting production on it. There is active work on a Parquet-based storage format in a separate gateway, and a few organisations have started adopting it, but it is still in rapid development and has not landed in the main Thanos repository. It is a direction to watch for future query efficiency, not something to build a multi-cluster rollout around today.
Running Thanos Across Clusters: What It Adds Up To
Multi-cluster Thanos rewards teams that treat three things as first-class: the fan-out path, so your global view does not hostage itself to the slowest store; the downsampling and retention lifecycle, so you are not paying for resolution nobody queries; and above all the Compactor, the one component that is a genuine single point of failure and the one most setups under-monitor. None of these are exotic. They are just the parts that a single-cluster proof of concept never exercises.
If your Prometheus footprint has outgrown one cluster and Thanos is creaking in exactly these places, this is the kind of work we do day to day. You can see how we approach Thanos long-term storage and multi-cluster observability, or follow our engineering work on LinkedIn.
Frequently Asked Questions
Should I use the Thanos Sidecar or Receiver for a multi-cluster setup?
The Sidecar is the low-friction entry point and is fine for a handful of clusters: it uploads each Prometheus's blocks to object storage and serves recent data. As the cluster count climbs, the fan-out surface grows with it, which is why most teams move to the Receiver or plain remote-write at scale. The Receiver centralises ingestion so the query path no longer depends on reaching every remote Sidecar, at the cost of running a stateful ingestion tier.
Why does the Thanos Compactor halt?
The most common cause is overlapping blocks: two or more blocks that share the same external labels and overlap in time. Thanos treats that as unhealthy and stops the compactor rather than risk corrupting data. The usual root cause is external labels that are not unique and persistent per Prometheus instance. If you run Receivers with replication greater than one, overlaps are expected and vertical compaction with deduplication is the intended fix.
Does Thanos downsampling reduce storage costs?
No, it increases storage. Downsampling creates additional five-minute and one-hour resolution copies alongside the raw data, so the bucket grows. What it buys is query speed on long time ranges. Because each resolution is a separate copy, set retention per resolution rather than globally.
Which Thanos version should I run in production?
Pin 0.42.0 or later. It patches CVE-2026-33186, a high-severity authorization bypass, and fixes several multi-cluster issues: fan-out visibility in Query, external-label handling in tiered Querier topologies, and a compactor deduplication footgun. Earlier 0.41.x also carries the gRPC batching that cuts cross-region network throughput.
Procedure Team
Engineering Team
Expert engineers building production AI systems.