

Observability 101: Tools, Standards & Best Practices
Understand observability from first principles: traces, logs, metrics, alerts, dashboards, OpenTelemetry, and how tools like Grafana or Datadog fit into real workflows.
Share this blog on
Modern systems rarely fail without warning. Slow requests, rising error rates, or CPU spikes are early indicators, but without observability, teams operate in the dark.
Observability is the practice of understanding what’s happening inside your system through external outputs, such as traces, logs, metrics, alerts, and dashboards. In this fundamentals guide, we’ll cover the foundations of monitoring: how to capture the right signals, interpret them, and visualize system health.
We’ll also highlight where tools like Grafana, Datadog, New Relic, and PostHog fit into this journey, while keeping the focus on concepts and best practices - the mental models every developer needs before diving into tool setup.
The Challenge of System Monitoring Without Observability
In fast-moving systems, small issues often snowball into outages. A sudden spike in latency, a memory leak, or a failed API call can stay hidden until customers feel the impact. When this happens, engineers are left scrambling with little more than a vague 500 Internal Server Error as a clue.
This is the gap observability fills. Without signals like traces, logs, and metrics, incident response becomes guesswork; teams don’t know where requests are slowing down or why failures are happening. The result is slower recovery, higher downtime, and frustrated users.
By establishing observability early, teams move from reactive firefighting to proactive monitoring. Instead of chasing symptoms, they can see exactly where in the system things are breaking and fix issues before they escalate.
The Observability Basics: Traces, Logs, Metrics, Alerts, and Dashboard
After seeing how risky it is to run systems blind, let’s explore the five building blocks of observability. Together, these signals give engineers the visibility they need to detect, diagnose, and fix issues before they affect users.
1. Traces
A trace follows the full path of a single request as it travels through services like APIs, databases, and caches.
Each operation is captured as a span.
The first operation is the root span, with child spans nested inside it.
Attributes add context, such as the type of request or the user involved.
Visualizing traces makes their value clear - you can see how one service hands off work to another and pinpoint the exact step where latency builds up or failures occur.
2. Logs
Logs are timestamped records of events and system behavior. They capture details that traces alone cannot provide.
Structured logs (e.g., JSON) are machine-readable and easier to analyze.
Unstructured logs (plain text) are less consistent but still useful for debugging.
Traces point you to where the problem is happening; logs reveal what exactly went wrong - the error message, the stack trace, or the failed query. This is why logs are often considered the “ground truth” in monitoring.
3. Metrics
Metrics are numerical indicators of system health collected over time. They help teams measure performance trends and spot anomalies. Common backend system analysis metrics include:
Latency – How long requests take (p50, p90, p95, p99 percentiles show the range of user experiences).
Throughput – Requests, transactions, or queries processed per second.
Availability – Percentage of uptime, often tracked against SLAs or SLOs.
Error rate – Percentage of failed requests compared to total requests.
Apdex score – A 0–1 scale measuring user satisfaction with response times.
Metrics are often tracked using four fundamental types:
Gauge – A single value that can go up or down (e.g., CPU usage %, memory in MB).
Counter (Count) – A value that only increases over time (e.g., total requests served, errors logged).
Histogram – Groups observations into “buckets” to show distribution (e.g., how many requests fell into 0–10ms, 10–50ms, 50–100ms).
Summary – Similar to a histogram but gives pre-calculated quantiles/percentiles (e.g., median latency, p95 latency).
Metrics are closely related: when availability drops, error rates usually rise. Setting thresholds - for example, alerting if availability falls below 99.9%, helps teams respond before customers notice.
4. Alerts
Alerts turn raw metrics into actionable notifications. They ensure that when a critical threshold is crossed, the right people are notified immediately.
Thresholds – Example: error rate > 5%.
Indicators – Latency, CPU usage, memory, or availability.
Severity levels – From early warnings to critical outages.
Sensitivity – How quickly alerts trigger; too strict creates noise, too loose causes missed issues.
Notification channels – Slack, email, PagerDuty, Opsgenie, or webhooks.
Well-tuned alerts are crucial. If alerts are too noisy, developers start ignoring them; if they’re too relaxed, critical outages slip by unnoticed. The balance between urgency and noise often defines the effectiveness of a monitoring setup.
5. Dashboards
Dashboards bring everything together in one place. They turn traces, logs, and metrics into a visual overview that makes patterns easier to spot.
Tools like Grafana provide a consolidated view of system health.
PromQL (Prometheus Query Language) allows developers to query and filter metrics for precise monitoring.
A good dashboard makes system health obvious at a glance. Instead of digging through logs or waiting for alerts, teams can see latency spikes, error trends, or unusual throughput in real time and act before it escalates.
The Observability Toolbox: Standards, Databases, and Monitoring Solutions
System monitoring isn’t just about concepts; it relies on standards and solutions that make it possible to collect, store, and visualize data at scale. Here are the essentials every engineer should know.
OpenTelemetry: The Industry Standard
At the heart of modern observability is OpenTelemetry, often called the “gold standard.” It defines how traces, logs, and metrics should be captured in a consistent way across programming languages and frameworks. By following this standard, teams avoid vendor lock-in and ensure their data can flow into any tool they choose, from open-source dashboards to enterprise platforms.
What is OTLP?
OTLP stands for OpenTelemetry Protocol. It is the protocol used by OpenTelemetry to transmit observability data (traces, metrics, logs) between different components in the pipeline.
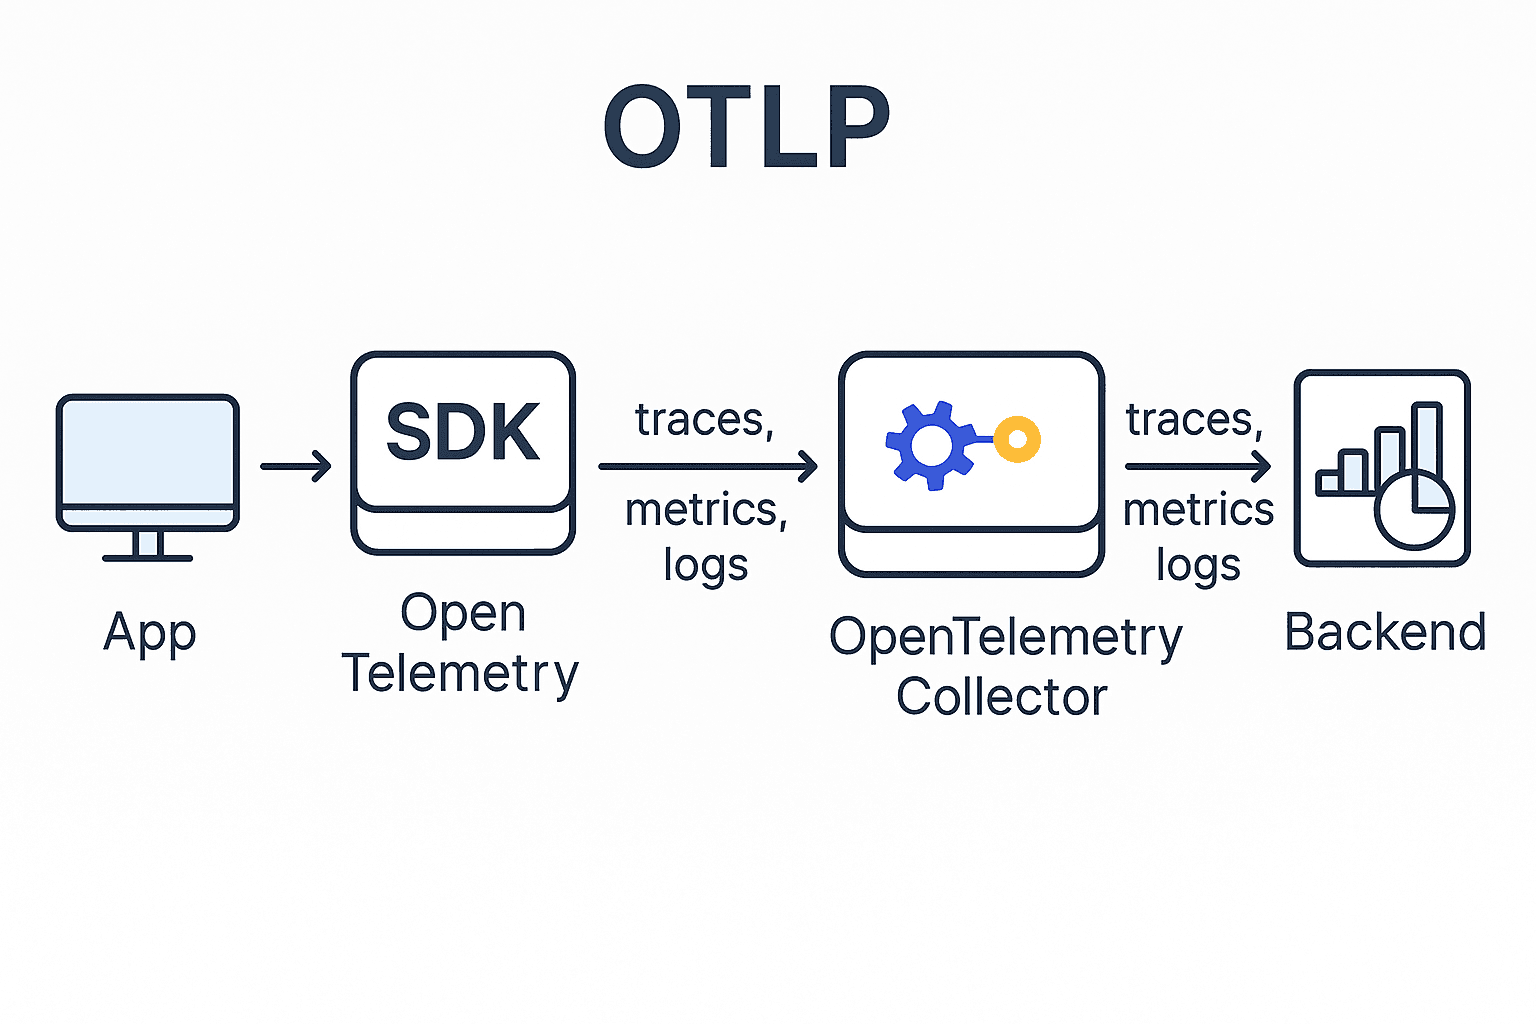
In practice, the flow looks like this:
Application (App) – Generates telemetry data.
OpenTelemetry SDK – Instruments the app and collects data.
OpenTelemetry Collector – Normalizes, processes, and exports telemetry data.
Backend (e.g., Grafana, DataDog, Prometheus, etc.) – Stores and visualizes metrics, logs, and traces.
Flow Diagram: OTLP in Action
(Image Alt Tag: Observability diagram showing logs, metrics, traces, alerts, and dashboards)
This pipeline ensures the data travels in a vendor-neutral, standard format, making it easier for teams to integrate multiple monitoring tools without rewriting instrumentation.
ClickHouse: Fast Data Queries
Collecting data is one thing - querying it at speed is another. ClickHouse is a popular external database designed for high-volume backend data workloads. It’s designed for high-volume, time-series data and makes queries like “show me all error rates from the past hour” run quickly, even at scale. This speed is critical when debugging live incidents.
Visualization and Monitoring Tools
Several tools are widely used to make system visibility practical:
Grafana – An open-source platform widely adopted for flexible dashboards. It connects to Prometheus, cloud services, and databases to provide real-time insights into system performance.
Prometheus – A time-series database that pairs naturally with Grafana. With PromQL, you can query metrics with labels and filters.
DataDog and New Relic – Enterprise platforms that combine logs, traces, metrics, and alerting in one place. They’re powerful but often used by larger organizations due to cost and scale.
PostHog – Originally a product analytics tool, but also used to track user sessions and events. It can complement observability efforts when product usage and backend performance need to be connected.
Choosing between these tools depends on scale and operational maturity. Enterprise SaaS platforms, such as Datadog or New Relic, simplify setup and management but can become costly as data volumes grow. Open-source stacks like Grafana and Prometheus, while requiring in-house expertise, offer greater control and cost efficiency once your monitoring needs cross a certain threshold.
If you're building or scaling backend systems and want observability built in from day one, not bolted on later, our Back-End Development Services ensure systems are designed with monitoring, tracing, and reliability at the core.
The Payoff: Observability as a Feedback Loop
Each signal - traces, logs, metrics, alerts, and dashboards - serves a purpose on its own. But their real strength comes from how they work together as a closed feedback loop.
A trace highlights the failing step, logs provide context, metrics show the scale of impact, and dashboards and alerts turn this into real-time action. Together, they shorten the time from detection → alert → investigation → resolution → prevention.
This feedback loop also improves long-term reliability. By studying patterns like recurring spikes in error rates or drops in availability, teams can address root causes and strengthen the system over time.
In practice, observability shifts engineering from reactive firefighting to proactive monitoring. It’s not just about spotting outages; it’s about building confidence that your backend can handle change, scale, and unexpected failures.
Closing Reflection: From Data to Clarity
Observability isn’t about collecting endless logs or flooding dashboards with charts. It’s about clarity, being able to look at your system and quickly answer: What’s happening, and why?
For backend teams, this clarity comes from using the right mix of signals: traces to follow requests, logs to capture details, metrics to track performance, alerts to act quickly, and dashboards to see the bigger picture. Together, they form a feedback loop that makes systems more reliable and engineers more confident.
At this level, the key is understanding concepts before diving into tool setups or vendor choices. Whether you eventually adopt open-source tools like Grafana and Prometheus, or enterprise platforms like DataDog and New Relic, the foundation remains the same: visibility transforms systems from black boxes into transparent, measurable, and trustworthy services.
The next step is simple: ask yourself, if my system failed right now, would I know where to look first? If the answer is no, that’s where observability begins. If you're looking to implement this practically: dashboards, alerting, OpenTelemetry pipelines, we help teams do exactly that through our DevOps Services and Solutions.
Helpful Resources
https://sre.google/sre-book/monitoring-distributed-systems/#xref_monitoring_golden-signals - Google’s SRE Book (Four Golden Signals)
If you found this post valuable, I’d love to hear your thoughts. Let’s connect and continue the conversation on LinkedIn.
Curious what Backend Observability can do for you?
Our team is just a message away.


