
Your Prometheus pod got OOM-killed again. You added one label with high cardinality, memory climbed past what the node has, and now you are staring at a Grafana panel that goes blank fifteen days into the past. This is the point where most teams start searching for Prometheus long-term storage, and it is also the point where the decision usually goes wrong.
It goes wrong because the question gets framed as a benchmark. Which tool compresses better, which uses less memory, which ingests more samples per second. Those numbers are real, but they are not what breaks your budget or your on-call rotation eighteen months from now. What breaks it is how much human attention the system demands after it is installed. This guide walks through the three storage options that actually matter in 2026, when each one is the right call, and the cost that tends to get left out of the comparison table.
Why Prometheus Needs Long-Term Storage in the First Place
Prometheus was built to be simple and self-contained, and that design has a hard edge. It stores data locally in two-hour TSDB blocks and keeps them until the retention window expires, which defaults to 15 days. There is no built-in replication, no failover, and no way to query across more than one Prometheus at once. A single instance is a single point of failure with a two-week memory.
For a lot of teams that is fine, right up until it isn't. The wall usually shows up in one of three ways. You need to compare this quarter's latency to last quarter's and the data is gone. A cluster grows and one Prometheus can no longer hold the active series in RAM. Or you run several clusters and need a single pane of glass across all of them. Community reports commonly put the practical ceiling for a single Prometheus somewhere around 10 million active series before memory pressure forces the issue, though the real number depends heavily on your cardinality and hardware. If you are already designing a monitoring layer that has to survive that kind of growth, the storage question is one part of surviving 10 million active time series.
Long-term storage solves the three problems in one move: it puts historical metrics in object storage that grows on its own, it lets you query globally across instances, and it gives you retention measured in years.
The Three Prometheus Long-Term Storage Options Worth Shortlisting in 2026
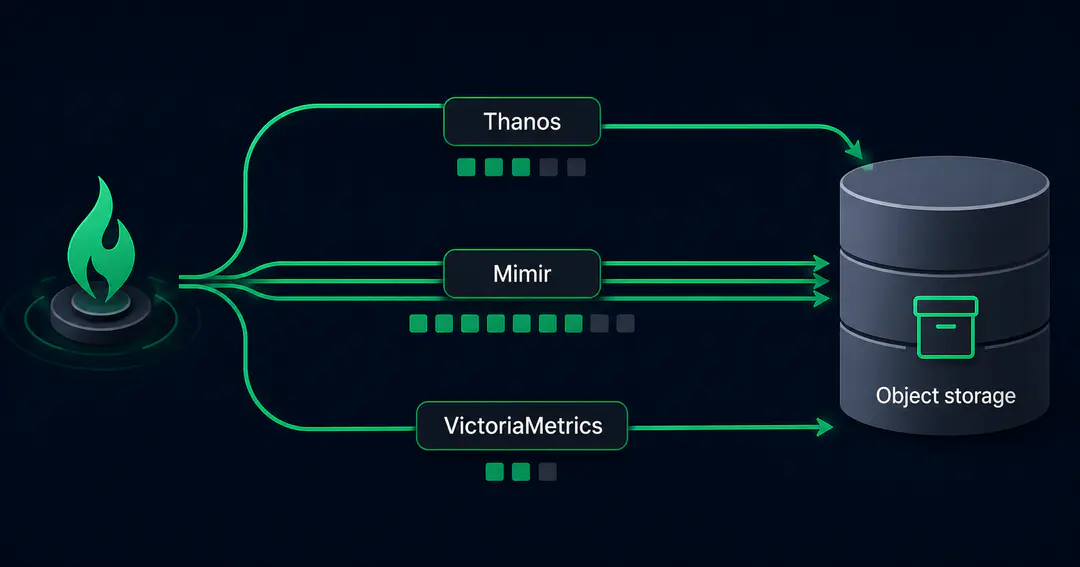
In 2026 the shortlist is Thanos, Grafana Mimir, and VictoriaMetrics. Each takes a different architectural bet, which is really what you are choosing between.
There is a fourth name you will still see: Cortex. It is worth being accurate about, because the internet is full of people declaring it dead. It is not. Cortex is still a CNCF incubating project, still shipping releases, and still had a KubeCon talk in April 2026. The honest reason it is not on this shortlist is narrower. Grafana forked Cortex to build Mimir and took a large share of the commercial momentum with it, so most teams evaluating a multi-tenant backend today end up comparing Mimir instead. If you already run Cortex and it works, you do not have an urgent migration on your hands.
Thanos: A Wrapper Around the Prometheus You Already Run
Thanos is the most common first step away from single-node limits, and the reason is philosophical as much as technical. It wraps your existing Prometheus. Your collection setup, your scrape configs, your alerting rules all stay where they are. Thanos adds components around them: a way to ship TSDB blocks to object storage, a store gateway to read them back, a querier to fan out across everything, and a compactor to merge and downsample blocks over time.
It is not a niche choice. The companies running Thanos in production include Adobe, eBay, SoundCloud, and Monzo, alongside Hotstar, Blinkit, OYO, and Udaan closer to home.
There are two ways to get data in. The original sidecar model attaches a container to each Prometheus and uploads its blocks. It is the low-friction entry point and still the right starting place for small footprints. At scale, though, the community has largely shifted to the Thanos Receiver, or to remote-write, because querying across dozens of sidecars turns gRPC fan-out into a latency problem. If a guide tells you the sidecar is the default Thanos architecture and stops there, it is a year or two behind where real deployments have landed.
Thanos is the right call when you already run Prometheus and migration risk is your primary concern. It sits alongside what you already have, so your rollback path stays open the whole time. That property is worth more than it looks on a feature chart, because it means you can adopt long-term storage without betting the monitoring stack on a single cutover.
Grafana Mimir: Monitoring as a Platform Service
Grafana Mimir makes the opposite bet. It replaces the storage backend with a multi-tenant system of its own that you scale by adding replicas. It speaks the Prometheus remote-write protocol on the way in and full PromQL on the way out, so your dashboards and alert rules keep working, but underneath it is a distributed system with a distinct operational personality.
The version matters here. Mimir 3.0, released in late 2025, introduced an ingest storage architecture that decouples the read and write paths behind a Kafka-API buffer. Before that, the ingester sat in both paths, so heavy query load could starve ingestion. Two details most write-ups miss. The classic architecture is still supported, which makes this something you opt into rather than a forced migration. And the dependency is on the Kafka API, so Redpanda or WarpStream work in Kafka's place. The same release also made the Mimir Query Engine the default: it streams samples through a query rather than loading them in bulk, and cuts peak query memory by up to 92% by Grafana's own measurement. The line is on 3.1.x as of mid-2026, so check the release notes before you plan a capacity model around 3.0.
Mimir's standout feature is native multi-tenancy. It isolates metrics between tenants at both ingestion and query time using a tenant header, which is exactly what you need when you are running monitoring as a service for many engineering teams with separate quotas and access. The cost of that power is a multi-component system that expects a distributed-systems skill set to operate.
Mimir is the right call when you serve many tenants, need strict isolation and quotas, or you are already inside the Grafana ecosystem and would rather pay for the managed option than run it yourself. It costs more to operate than Thanos, and it earns that cost only when scale and tenancy demand it.
VictoriaMetrics: The Single-Binary Argument
VictoriaMetrics is a from-scratch time-series database that accepts Prometheus remote-write and stores data in its own columnar format. Its pitch is low resource use and a small operating surface in the same package. By the project's own benchmarks it compresses far more aggressively than vanilla Prometheus and uses noticeably less memory than the block-based alternatives for the same workload. For small and mid-size deployments it runs as a single binary that handles ingestion, storage, and query together, which is a dramatically smaller operational surface than Mimir's microservices.
It has the adopter list to back the pitch: teams that moved to VictoriaMetrics include Roblox, Spotify, Grammarly, Wix, Adidas, and CERN.
Two caveats belong in any recommendation. First, VictoriaMetrics implements MetricsQL, a PromQL superset. Roughly the whole of standard PromQL works unchanged, but there are edge cases, particularly around native histograms and how counter resets extrapolate, so critical alert rules deserve a test before you fully commit. Second, the open-source single-node build has no tenant isolation. Multi-tenancy lives in the cluster and enterprise editions. If hard tenant separation is a requirement, that changes your evaluation.
VictoriaMetrics is the right call when your constraint is operational overhead more than raw throughput or tenancy, which describes most teams. It is the pragmatic default when you want long-term retention without hiring to babysit it.
Operational Cost: The Layer That Usually Decides It

Think of total cost of ownership in three layers. The benchmark tables in every other comparison cover exactly one of them.
The first layer is infrastructure: object storage, compute, and egress. Predictable, and everyone budgets for it.
The second layer is compaction and downsampling, and it is the one that produces surprise bills. Adding any of these systems adds a compaction process that merges small blocks into larger ones and, in Thanos and Mimir, downsamples older data to cheaper resolutions. Left misconfigured, retention grows without bound, and object storage cost climbs quietly until someone opens the billing console. Downsampling in particular trips people up, because it initially increases storage before it reduces it: raw and downsampled blocks coexist for a window. You have to configure retention per resolution deliberately, or the cheaper tier costs more than the raw data did.
The third layer is operational, and it dominates the other two. The real question is how many engineers it takes to keep the system healthy at 3am. A Mimir cluster that needs a couple of SREs to run well carries a salary cost that, for most mid-size deployments, exceeds the entire compute bill it sits on top of. A VictoriaMetrics single binary that runs untouched for months carries almost none of that. This is the same pattern that shows up whenever a team audits its Kubernetes cost optimization: the money goes somewhere other than the line item on the invoice. Price all three layers, and the system that wins the benchmark chart is frequently the more expensive one to own.
Mimir earns that weight when tenancy and scale genuinely require it and you have the team to match. Below that line, it is how monitoring budgets quietly balloon.
The Prometheus Storage Decision Checklist
Feature matrices flatten exactly the tradeoffs that matter. A short set of questions gets you further.
- Do you already run Prometheus and cannot tolerate a risky cutover? Start with Thanos. It extends what you have and keeps rollback open.
- Do you serve metrics to many teams that need quotas and isolation? Mimir, and budget for the platform team to run it.
- Is your real constraint headcount more than throughput? VictoriaMetrics, single binary, and move on.
- Are you under roughly 10 million active series with a single team? You may not need any of these yet. Confirm you have a real retention or HA requirement before you add a distributed system to your life.
- Do you need years of retention for compliance? Any object-storage-backed option works. Thanos or Mimir, with retention configured explicitly per resolution.
- Are you already committed to Grafana Cloud? Mimir as the managed offering is the path of least resistance.
The summary: Thanos for minimal migration risk, Mimir for large multi-tenant platforms with SRE capacity, VictoriaMetrics for most other teams. If two options tie on your requirements, pick the one that asks less of your people.
How to Migrate Without a Big-Bang Cutover
Whatever you choose, do not flip everything at once. The pattern that consistently works is incremental.
Start by auditing cardinality, because a small fraction of your metrics usually drives most of the storage cost. Find them and decide what you actually need before you move anything. Then add remote-write to a test instance of your chosen backend while keeping Prometheus exactly as it is for alerting. Let the two run side by side long enough to trust the new store, including a real test of your alert rules against its query behavior. Move global querying over last, pointing Grafana at the long-term store once you are confident. At no point in that sequence are you one bad deploy away from losing your monitoring.
When It Is Worth Bringing In Help
For a cluster already in production, picking the wrong tool of the three is rarely what hurts. All three are solid. The expensive mistakes are buying operational weight you cannot staff, and configuring compaction and retention in a way that quietly runs up the bill. Both are painful to unwind once data and dashboards depend on the setup.
Matching the storage architecture to the team that has to operate it is the part worth getting right before the migration, not after. Procedure runs Prometheus, Thanos, and long-term storage migrations in production for client engineering teams, and can help you pressure-test that call: talk to us about long-term Prometheus storage, or follow our engineering work on LinkedIn.
Frequently Asked Questions
Thanos vs Mimir: which should I use?
Thanos extends your existing Prometheus from the outside, so it is the lower-risk choice when you want to keep your current setup and your rollback options intact. Mimir replaces the storage backend with a multi-tenant system built to scale by adding replicas, and fits large platform teams that need strict tenant isolation and can staff the operational load. If you are not running monitoring as a service for many teams, Thanos is usually the simpler answer.
Is VictoriaMetrics a drop-in Prometheus replacement?
For the storage layer and the large majority of PromQL queries, effectively yes. It supports Prometheus remote-write and implements MetricsQL, a PromQL superset. Edge cases exist around native histograms and counter-reset behavior, so test your critical alert rules before fully migrating rather than assuming exact parity.
Thanos vs VictoriaMetrics: what is the real difference?
Thanos keeps Prometheus at the center and adds long-term storage around it, which means minimal change to how you collect metrics but more moving components to operate. VictoriaMetrics replaces the storage layer with a single database that does more with less memory and is simpler to run, but it is a genuine backend swap. Thanos favors compatibility and low migration risk, VictoriaMetrics favors operational simplicity.
Do I need long-term storage if I only run one cluster?
Not necessarily. If a single Prometheus comfortably holds your active series and 15 days of retention meets your needs, adding Thanos, Mimir, or VictoriaMetrics is complexity you do not need yet. Add long-term storage when you have a concrete requirement: longer retention, high availability, or querying across clusters.
Procedure Team
Engineering Team
Expert engineers building production AI systems.